Compare outcomes from differential analysis based on different imputation methods#
load scores based on
10_1_ald_diff_analysis
Parameters#
Default and set parameters for the notebook.
folder_experiment = 'runs/appl_ald_data/plasma/proteinGroups'

target = 'kleiner'
model_key = 'VAE'
baseline = 'RSN'
out_folder = 'diff_analysis'
selected_statistics = ['p-unc', '-Log10 pvalue', 'qvalue', 'rejected']

disease_ontology = 5082  # code from https://disease-ontology.org/
# split diseases notebook? Query gene names for proteins in file from uniprot?
annotaitons_gene_col = 'PG.Genes'
# Parameters
disease_ontology = 10652
folder_experiment = "runs/alzheimer_study"
target = "AD"
baseline = "PI"
model_key = "CF"
out_folder = "diff_analysis"
annotaitons_gene_col = "None"
Add set parameters to configuration
root - INFO     Removed from global namespace: folder_experiment
root - INFO     Removed from global namespace: target
root - INFO     Removed from global namespace: model_key
root - INFO     Removed from global namespace: baseline
root - INFO     Removed from global namespace: out_folder
root - INFO     Removed from global namespace: selected_statistics
root - INFO     Removed from global namespace: disease_ontology
root - INFO     Removed from global namespace: annotaitons_gene_col
root - INFO     Already set attribute: folder_experiment has value runs/alzheimer_study
root - INFO     Already set attribute: out_folder has value diff_analysis
{'annotaitons_gene_col': 'None',
 'baseline': 'PI',
 'data': PosixPath('runs/alzheimer_study/data'),
 'disease_ontology': 10652,
 'folder_experiment': PosixPath('runs/alzheimer_study'),
 'freq_features_observed': PosixPath('runs/alzheimer_study/freq_features_observed.csv'),
 'model_key': 'CF',
 'out_figures': PosixPath('runs/alzheimer_study/figures'),
 'out_folder': PosixPath('runs/alzheimer_study/diff_analysis/AD/PI_vs_CF'),
 'out_metrics': PosixPath('runs/alzheimer_study'),
 'out_models': PosixPath('runs/alzheimer_study'),
 'out_preds': PosixPath('runs/alzheimer_study/preds'),
 'scores_folder': PosixPath('runs/alzheimer_study/diff_analysis/AD/scores'),
 'selected_statistics': ['p-unc', '-Log10 pvalue', 'qvalue', 'rejected'],
 'target': 'AD'}
Excel file for exports#
files_out = dict()
writer_args = dict(float_format='%.3f')

fname = args.out_folder / 'diff_analysis_compare_methods.xlsx'
files_out[fname.name] = fname
writer = pd.ExcelWriter(fname)
logger.info("Writing to excel file: %s", fname)
root - INFO Writing to excel file: runs/alzheimer_study/diff_analysis/AD/PI_vs_CF/diff_analysis_compare_methods.xlsx
Load scores#
Load baseline model scores#
Show all statistics, later use selected statistics
| model | PI | ||||||||
|---|---|---|---|---|---|---|---|---|---|
| var | SS | DF | F | p-unc | np2 | -Log10 pvalue | qvalue | rejected | |
| protein groups | Source | ||||||||
| A0A024QZX5;A0A087X1N8;P35237 | AD | 0.833 | 1 | 1.390 | 0.240 | 0.007 | 0.620 | 0.397 | False |
| age | 0.147 | 1 | 0.246 | 0.620 | 0.001 | 0.207 | 0.750 | False | |
| Kiel | 2.439 | 1 | 4.072 | 0.045 | 0.021 | 1.347 | 0.112 | False | |
| Magdeburg | 4.762 | 1 | 7.949 | 0.005 | 0.040 | 2.274 | 0.020 | True | |
| Sweden | 8.268 | 1 | 13.800 | 0.000 | 0.067 | 3.574 | 0.002 | True | |
| ... | ... | ... | ... | ... | ... | ... | ... | ... | ... |
| S4R3U6 | AD | 0.531 | 1 | 0.525 | 0.469 | 0.003 | 0.328 | 0.623 | False |
| age | 1.792 | 1 | 1.774 | 0.185 | 0.009 | 0.734 | 0.328 | False | |
| Kiel | 0.002 | 1 | 0.002 | 0.961 | 0.000 | 0.017 | 0.976 | False | |
| Magdeburg | 2.675 | 1 | 2.648 | 0.105 | 0.014 | 0.978 | 0.218 | False | |
| Sweden | 15.376 | 1 | 15.221 | 0.000 | 0.074 | 3.878 | 0.001 | True | |
7105 rows × 8 columns
Load selected comparison model scores#
| model | CF | ||||||||
|---|---|---|---|---|---|---|---|---|---|
| var | SS | DF | F | p-unc | np2 | -Log10 pvalue | qvalue | rejected | |
| protein groups | Source | ||||||||
| A0A024QZX5;A0A087X1N8;P35237 | AD | 1.070 | 1 | 7.461 | 0.007 | 0.038 | 2.161 | 0.020 | True |
| age | 0.005 | 1 | 0.038 | 0.846 | 0.000 | 0.073 | 0.898 | False | |
| Kiel | 0.324 | 1 | 2.260 | 0.134 | 0.012 | 0.872 | 0.231 | False | |
| Magdeburg | 0.606 | 1 | 4.223 | 0.041 | 0.022 | 1.385 | 0.088 | False | |
| Sweden | 2.063 | 1 | 14.383 | 0.000 | 0.070 | 3.699 | 0.001 | True | |
| ... | ... | ... | ... | ... | ... | ... | ... | ... | ... |
| S4R3U6 | AD | 1.832 | 1 | 3.644 | 0.058 | 0.019 | 1.238 | 0.117 | False |
| age | 0.856 | 1 | 1.703 | 0.193 | 0.009 | 0.713 | 0.307 | False | |
| Kiel | 2.730 | 1 | 5.430 | 0.021 | 0.028 | 1.681 | 0.050 | False | |
| Magdeburg | 3.283 | 1 | 6.528 | 0.011 | 0.033 | 1.943 | 0.030 | True | |
| Sweden | 18.244 | 1 | 36.280 | 0.000 | 0.160 | 8.065 | 0.000 | True | |
7105 rows × 8 columns
Combined scores#
show only selected statistics for comparsion
| model | CF | PI | |||||||
|---|---|---|---|---|---|---|---|---|---|
| var | p-unc | -Log10 pvalue | qvalue | rejected | p-unc | -Log10 pvalue | qvalue | rejected | |
| protein groups | Source | ||||||||
| A0A024QZX5;A0A087X1N8;P35237 | AD | 0.007 | 2.161 | 0.020 | True | 0.240 | 0.620 | 0.397 | False |
| Kiel | 0.134 | 0.872 | 0.231 | False | 0.045 | 1.347 | 0.112 | False | |
| Magdeburg | 0.041 | 1.385 | 0.088 | False | 0.005 | 2.274 | 0.020 | True | |
| Sweden | 0.000 | 3.699 | 0.001 | True | 0.000 | 3.574 | 0.002 | True | |
| age | 0.846 | 0.073 | 0.898 | False | 0.620 | 0.207 | 0.750 | False | |
| ... | ... | ... | ... | ... | ... | ... | ... | ... | ... |
| S4R3U6 | AD | 0.058 | 1.238 | 0.117 | False | 0.469 | 0.328 | 0.623 | False |
| Kiel | 0.021 | 1.681 | 0.050 | False | 0.961 | 0.017 | 0.976 | False | |
| Magdeburg | 0.011 | 1.943 | 0.030 | True | 0.105 | 0.978 | 0.218 | False | |
| Sweden | 0.000 | 8.065 | 0.000 | True | 0.000 | 3.878 | 0.001 | True | |
| age | 0.193 | 0.713 | 0.307 | False | 0.185 | 0.734 | 0.328 | False | |
7105 rows × 8 columns
Models in comparison (name mapping)
{'CF': 'CF', 'PI': 'PI'}
Describe scores#
| model | CF | PI | ||||
|---|---|---|---|---|---|---|
| var | p-unc | -Log10 pvalue | qvalue | p-unc | -Log10 pvalue | qvalue |
| count | 7,105.000 | 7,105.000 | 7,105.000 | 7,105.000 | 7,105.000 | 7,105.000 |
| mean | 0.225 | 3.283 | 0.278 | 0.261 | 2.476 | 0.338 |
| std | 0.292 | 6.223 | 0.319 | 0.303 | 5.328 | 0.331 |
| min | 0.000 | 0.000 | 0.000 | 0.000 | 0.000 | 0.000 |
| 25% | 0.001 | 0.408 | 0.002 | 0.004 | 0.335 | 0.016 |
| 50% | 0.062 | 1.209 | 0.124 | 0.121 | 0.916 | 0.243 |
| 75% | 0.391 | 3.272 | 0.521 | 0.463 | 2.411 | 0.617 |
| max | 1.000 | 86.405 | 1.000 | 0.999 | 146.241 | 0.999 |
One to one comparison of by feature:#
/tmp/ipykernel_88830/3761369923.py:2: FutureWarning: Starting with pandas version 3.0 all arguments of to_excel except for the argument 'excel_writer' will be keyword-only.
  scores.to_excel(writer, 'scores', **writer_args)
| model | CF | PI | |||||||
|---|---|---|---|---|---|---|---|---|---|
| var | p-unc | -Log10 pvalue | qvalue | rejected | p-unc | -Log10 pvalue | qvalue | rejected | |
| protein groups | Source | ||||||||
| A0A024QZX5;A0A087X1N8;P35237 | AD | 0.007 | 2.161 | 0.020 | True | 0.240 | 0.620 | 0.397 | False |
| A0A024R0T9;K7ER74;P02655 | AD | 0.035 | 1.460 | 0.077 | False | 0.059 | 1.228 | 0.139 | False |
| A0A024R3W6;A0A024R412;O60462;O60462-2;O60462-3;O60462-4;O60462-5;Q7LBX6;X5D2Q8 | AD | 0.380 | 0.420 | 0.510 | False | 0.040 | 1.393 | 0.103 | False |
| A0A024R644;A0A0A0MRU5;A0A1B0GWI2;O75503 | AD | 0.251 | 0.600 | 0.376 | False | 0.420 | 0.377 | 0.580 | False |
| A0A075B6H7 | AD | 0.004 | 2.389 | 0.013 | True | 0.027 | 1.567 | 0.075 | False |
| ... | ... | ... | ... | ... | ... | ... | ... | ... | ... |
| Q9Y6R7 | AD | 0.175 | 0.756 | 0.284 | False | 0.175 | 0.756 | 0.316 | False |
| Q9Y6X5 | AD | 0.189 | 0.724 | 0.301 | False | 0.070 | 1.155 | 0.159 | False |
| Q9Y6Y8;Q9Y6Y8-2 | AD | 0.083 | 1.079 | 0.158 | False | 0.083 | 1.079 | 0.182 | False |
| Q9Y6Y9 | AD | 0.628 | 0.202 | 0.733 | False | 0.348 | 0.459 | 0.512 | False |
| S4R3U6 | AD | 0.058 | 1.238 | 0.117 | False | 0.469 | 0.328 | 0.623 | False |
1421 rows × 8 columns
And the descriptive statistics of the numeric values:
| model | CF | PI | ||||
|---|---|---|---|---|---|---|
| var | p-unc | -Log10 pvalue | qvalue | p-unc | -Log10 pvalue | qvalue |
| count | 1,421.000 | 1,421.000 | 1,421.000 | 1,421.000 | 1,421.000 | 1,421.000 |
| mean | 0.239 | 1.580 | 0.299 | 0.252 | 1.411 | 0.334 |
| std | 0.293 | 1.831 | 0.315 | 0.291 | 1.654 | 0.316 |
| min | 0.000 | 0.000 | 0.000 | 0.000 | 0.001 | 0.000 |
| 25% | 0.007 | 0.385 | 0.020 | 0.013 | 0.368 | 0.041 |
| 50% | 0.089 | 1.052 | 0.165 | 0.121 | 0.917 | 0.242 |
| 75% | 0.412 | 2.161 | 0.542 | 0.428 | 1.899 | 0.588 |
| max | 0.999 | 20.851 | 1.000 | 0.999 | 25.104 | 0.999 |
and the boolean decision values
| model | CF | PI |
|---|---|---|
| var | rejected | rejected |
| count | 1421 | 1421 |
| unique | 2 | 2 |
| top | False | False |
| freq | 952 | 1031 |
Load frequencies of observed features#
| data | |
|---|---|
| frequency | |
| protein groups | |
| A0A024QZX5;A0A087X1N8;P35237 | 186 |
| A0A024R0T9;K7ER74;P02655 | 195 |
| A0A024R3W6;A0A024R412;O60462;O60462-2;O60462-3;O60462-4;O60462-5;Q7LBX6;X5D2Q8 | 174 |
| A0A024R644;A0A0A0MRU5;A0A1B0GWI2;O75503 | 196 |
| A0A075B6H7 | 91 |
| ... | ... |
| Q9Y6R7 | 197 |
| Q9Y6X5 | 173 |
| Q9Y6Y8;Q9Y6Y8-2 | 197 |
| Q9Y6Y9 | 119 |
| S4R3U6 | 126 |
1421 rows × 1 columns
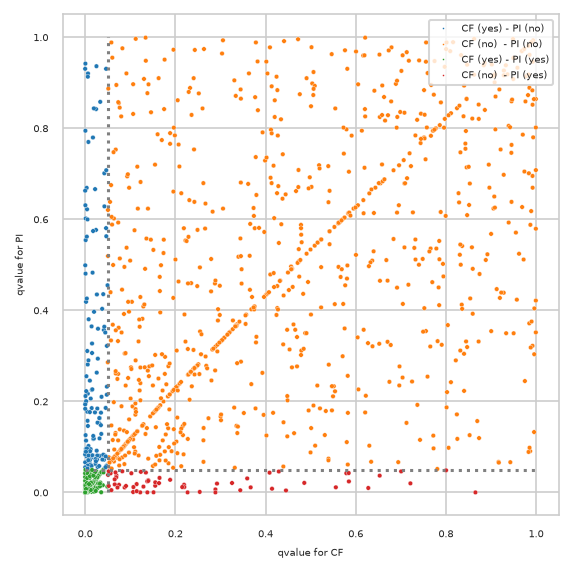
Plot qvalues of both models with annotated decisions#
Prepare data for plotting (qvalues)
| CF | PI | frequency | Differential Analysis Comparison | |
|---|---|---|---|---|
| protein groups | ||||
| A0A024QZX5;A0A087X1N8;P35237 | 0.020 | 0.397 | 186 | CF (yes) - PI (no) |
| A0A024R0T9;K7ER74;P02655 | 0.077 | 0.139 | 195 | CF (no) - PI (no) |
| A0A024R3W6;A0A024R412;O60462;O60462-2;O60462-3;O60462-4;O60462-5;Q7LBX6;X5D2Q8 | 0.510 | 0.103 | 174 | CF (no) - PI (no) |
| A0A024R644;A0A0A0MRU5;A0A1B0GWI2;O75503 | 0.376 | 0.580 | 196 | CF (no) - PI (no) |
| A0A075B6H7 | 0.013 | 0.075 | 91 | CF (yes) - PI (no) |
| ... | ... | ... | ... | ... |
| Q9Y6R7 | 0.284 | 0.316 | 197 | CF (no) - PI (no) |
| Q9Y6X5 | 0.301 | 0.159 | 173 | CF (no) - PI (no) |
| Q9Y6Y8;Q9Y6Y8-2 | 0.158 | 0.182 | 197 | CF (no) - PI (no) |
| Q9Y6Y9 | 0.733 | 0.512 | 119 | CF (no) - PI (no) |
| S4R3U6 | 0.117 | 0.623 | 126 | CF (no) - PI (no) |
1421 rows × 4 columns
List of features with the highest difference in qvalues
| CF | PI | frequency | Differential Analysis Comparison | diff_qvalue | |
|---|---|---|---|---|---|
| protein groups | |||||
| P17302 | 0.000 | 0.942 | 135 | CF (yes) - PI (no) | 0.941 |
| A0A087WU43;A0A087WX17;A0A087WXI5;P12830;P12830-2 | 0.000 | 0.931 | 134 | CF (yes) - PI (no) | 0.931 |
| O60565 | 0.006 | 0.920 | 81 | CF (yes) - PI (no) | 0.914 |
| A0A075B6Q5 | 0.025 | 0.936 | 104 | CF (yes) - PI (no) | 0.911 |
| P48745 | 0.006 | 0.913 | 180 | CF (yes) - PI (no) | 0.907 |
| ... | ... | ... | ... | ... | ... |
| F5GY80;F5H7G1;P07358 | 0.047 | 0.057 | 197 | CF (yes) - PI (no) | 0.010 |
| Q9NX62 | 0.045 | 0.056 | 197 | CF (yes) - PI (no) | 0.010 |
| P00740;P00740-2 | 0.043 | 0.053 | 197 | CF (yes) - PI (no) | 0.010 |
| K7ERG9;P00746 | 0.042 | 0.052 | 197 | CF (yes) - PI (no) | 0.009 |
| Q16706 | 0.052 | 0.046 | 195 | CF (no) - PI (yes) | 0.006 |
201 rows × 5 columns
Differences plotted with created annotations#
pimmslearn.plotting - INFO Saved Figures to runs/alzheimer_study/diff_analysis/AD/PI_vs_CF/diff_analysis_comparision_1_CF
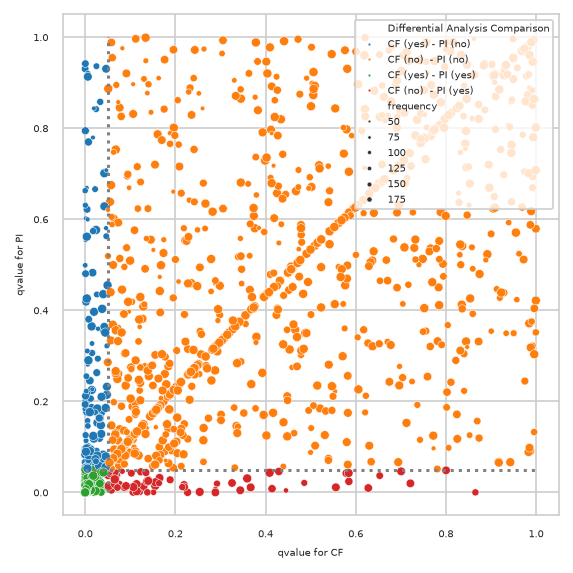
also showing how many features were measured (“observed”) by size of circle
pimmslearn.plotting - INFO Saved Figures to runs/alzheimer_study/diff_analysis/AD/PI_vs_CF/diff_analysis_comparision_2_CF
Only features contained in model#
this block exist due to a specific part in the ALD analysis of the paper
root - INFO No features only in new comparision model.
DISEASES DB lookup#
Query diseases database for gene associations with specified disease ontology id.
pimmslearn.databases.diseases - WARNING There are more associations available
| ENSP | score | |
|---|---|---|
| None | ||
| APP | ENSP00000284981 | 5.000 |
| PSEN2 | ENSP00000355747 | 5.000 |
| PSEN1 | ENSP00000326366 | 5.000 |
| APOE | ENSP00000252486 | 5.000 |
| TREM2 | ENSP00000362205 | 4.825 |
| ... | ... | ... |
| PTTG1 | ENSP00000377536 | 0.682 |
| ISL2 | ENSP00000290759 | 0.682 |
| hsa-miR-4433b-3p | hsa-miR-4433b-3p | 0.682 |
| NEURL1B | ENSP00000358815 | 0.681 |
| SLC26A4 | ENSP00000494017 | 0.681 |
10000 rows × 2 columns
only by model#
Only by model which were significant#
Only significant by RSN#
mask = (scores_common[(str(args.baseline), 'rejected')] & mask_different)
mask.sum()