Differential Analysis - Compare model imputation with standard imputation#
load missing values predictions (if specified)
leave all other values as they were
compare missing values predicition by model with baseline method (default: draw from shifted normal distribution. short RSN)
Parameters#
Default and set parameters for the notebook.
folder_experiment = "runs/appl_ald_data/plasma/proteinGroups"
folder_data: str = ''  # specify data directory if needed
fn_clinical_data = "data/ALD_study/processed/ald_metadata_cli.csv"
fn_qc_samples = ''  # 'data/ALD_study/processed/qc_plasma_proteinGroups.pkl'
f_annotations = 'data/ALD_study/processed/ald_plasma_proteinGroups_id_mappings.csv'


target: str = 'kleiner'
covar: str = 'age,bmi,gender_num,nas_steatosis_ordinal,abstinent_num'

file_format = "csv"
model_key = 'VAE'  # model(s) to evaluate
model = None  # default same as model_key, but could be overwritten (edge case)
value_name = 'intensity'
out_folder = 'diff_analysis'
template_pred = 'pred_real_na_{}.csv'  # fixed, do not change
# Parameters
f_annotations = None
folder_experiment = "runs/alzheimer_study"
fn_clinical_data = "runs/alzheimer_study/data/clinical_data.csv"
target = "AD"
covar = "age,Kiel,Magdeburg,Sweden"
model_key = "CF"
out_folder = "diff_analysis"
Add set parameters to configuration
root - INFO     Removed from global namespace: folder_experiment
root - INFO     Removed from global namespace: folder_data
root - INFO     Removed from global namespace: fn_clinical_data
root - INFO     Removed from global namespace: fn_qc_samples
root - INFO     Removed from global namespace: f_annotations
root - INFO     Removed from global namespace: target
root - INFO     Removed from global namespace: covar
root - INFO     Removed from global namespace: file_format
root - INFO     Removed from global namespace: model_key
root - INFO     Removed from global namespace: model
root - INFO     Removed from global namespace: value_name
root - INFO     Removed from global namespace: out_folder
root - INFO     Removed from global namespace: template_pred
{'folder_experiment': 'runs/alzheimer_study',
 'folder_data': '',
 'fn_clinical_data': 'runs/alzheimer_study/data/clinical_data.csv',
 'fn_qc_samples': '',
 'f_annotations': None,
 'target': 'AD',
 'covar': 'age,Kiel,Magdeburg,Sweden',
 'file_format': 'csv',
 'model_key': 'CF',
 'model': 'CF',
 'value_name': 'intensity',
 'out_folder': 'diff_analysis',
 'template_pred': 'pred_real_na_{}.csv'}
root - INFO     Already set attribute: folder_experiment has value runs/alzheimer_study
root - INFO     Already set attribute: fn_clinical_data has value runs/alzheimer_study/data/clinical_data.csv
root - INFO     Already set attribute: covar has value age,Kiel,Magdeburg,Sweden
root - INFO     Already set attribute: out_folder has value diff_analysis
{'covar': ['age', 'Kiel', 'Magdeburg', 'Sweden'],
 'data': PosixPath('runs/alzheimer_study/data'),
 'f_annotations': None,
 'file_format': 'csv',
 'fn_clinical_data': PosixPath('runs/alzheimer_study/data/clinical_data.csv'),
 'fn_qc_samples': '',
 'folder_data': '',
 'folder_experiment': PosixPath('runs/alzheimer_study'),
 'model': 'CF',
 'model_key': 'CF',
 'out_figures': PosixPath('runs/alzheimer_study/figures'),
 'out_folder': PosixPath('runs/alzheimer_study/diff_analysis/AD'),
 'out_metrics': PosixPath('runs/alzheimer_study'),
 'out_models': PosixPath('runs/alzheimer_study'),
 'out_preds': PosixPath('runs/alzheimer_study/preds'),
 'target': 'AD',
 'template_pred': 'pred_real_na_{}.csv',
 'value_name': 'intensity'}
Outputs of this notebook will be stored here:
PosixPath('runs/alzheimer_study/diff_analysis/AD')
Data#
MS proteomics or specified omics data#
Aggregated from data splits of the imputation workflow run before.
pimmslearn.io.datasplits - INFO     Loaded 'train_X' from file: runs/alzheimer_study/data/train_X.csv
pimmslearn.io.datasplits - INFO     Loaded 'val_y' from file: runs/alzheimer_study/data/val_y.csv
pimmslearn.io.datasplits - INFO     Loaded 'test_y' from file: runs/alzheimer_study/data/test_y.csv
Sample ID   protein groups
Sample_000  A0A024QZX5;A0A087X1N8;P35237                                                     15.912
            A0A024R0T9;K7ER74;P02655                                                         16.852
            A0A024R3W6;A0A024R412;O60462;O60462-2;O60462-3;O60462-4;O60462-5;Q7LBX6;X5D2Q8   15.570
            A0A024R644;A0A0A0MRU5;A0A1B0GWI2;O75503                                          16.481
            A0A075B6H7                                                                       17.301
                                                                                              ...
Sample_209  Q96ID5                                                                           16.074
            Q9H492;Q9H492-2                                                                  13.173
            Q9HC57                                                                           14.207
            Q9NPH3;Q9NPH3-2;Q9NPH3-5                                                         14.962
            Q9UGM5;Q9UGM5-2                                                                  16.871
Name: intensity, Length: 252009, dtype: float64
Clinical data#
Describe numerical data specified for use:
| AD | age | Kiel | Magdeburg | Sweden | |
|---|---|---|---|---|---|
| count | 210.000 | 197.000 | 210.000 | 210.000 | 210.000 |
| mean | 0.419 | 67.726 | 0.076 | 0.181 | 0.286 |
| std | 0.495 | 12.123 | 0.266 | 0.386 | 0.453 |
| min | 0.000 | 20.000 | 0.000 | 0.000 | 0.000 |
| 25% | 0.000 | 63.000 | 0.000 | 0.000 | 0.000 |
| 50% | 0.000 | 70.000 | 0.000 | 0.000 | 0.000 |
| 75% | 1.000 | 74.000 | 0.000 | 0.000 | 1.000 |
| max | 1.000 | 88.000 | 1.000 | 1.000 | 1.000 |
Entries with missing values
see how many rows have one missing values (for target and covariates)
only complete data is used for Differential Analysis
covariates are not imputed
np.int64(13)
Data description of data used:
| AD | age | Kiel | Magdeburg | Sweden | |
|---|---|---|---|---|---|
| count | 197.000 | 197.000 | 197.000 | 197.000 | 197.000 |
| mean | 0.447 | 67.726 | 0.081 | 0.193 | 0.305 |
| std | 0.498 | 12.123 | 0.274 | 0.396 | 0.461 |
| min | 0.000 | 20.000 | 0.000 | 0.000 | 0.000 |
| 25% | 0.000 | 63.000 | 0.000 | 0.000 | 0.000 |
| 50% | 0.000 | 70.000 | 0.000 | 0.000 | 0.000 |
| 75% | 1.000 | 74.000 | 0.000 | 0.000 | 1.000 |
| max | 1.000 | 88.000 | 1.000 | 1.000 | 1.000 |
AD
0   109
1    88
Name: count, dtype: int64
Check which patients with kleiner score have misssing covariates:
| AD | age | Kiel | Magdeburg | Sweden | |
|---|---|---|---|---|---|
| Sample ID | |||||
| Sample_021 | 0 | NaN | 0 | 0 | 0 |
| Sample_065 | 0 | NaN | 0 | 0 | 0 |
| Sample_066 | 0 | NaN | 0 | 0 | 0 |
| Sample_067 | 0 | NaN | 0 | 0 | 0 |
| Sample_082 | 0 | NaN | 0 | 0 | 0 |
| Sample_108 | 0 | NaN | 0 | 0 | 0 |
| Sample_120 | 0 | NaN | 0 | 0 | 0 |
| Sample_135 | 0 | NaN | 0 | 0 | 0 |
| Sample_138 | 0 | NaN | 0 | 0 | 0 |
| Sample_145 | 0 | NaN | 0 | 0 | 0 |
| Sample_147 | 0 | NaN | 0 | 0 | 0 |
| Sample_181 | 0 | NaN | 0 | 0 | 0 |
| Sample_204 | 0 | NaN | 0 | 0 | 0 |
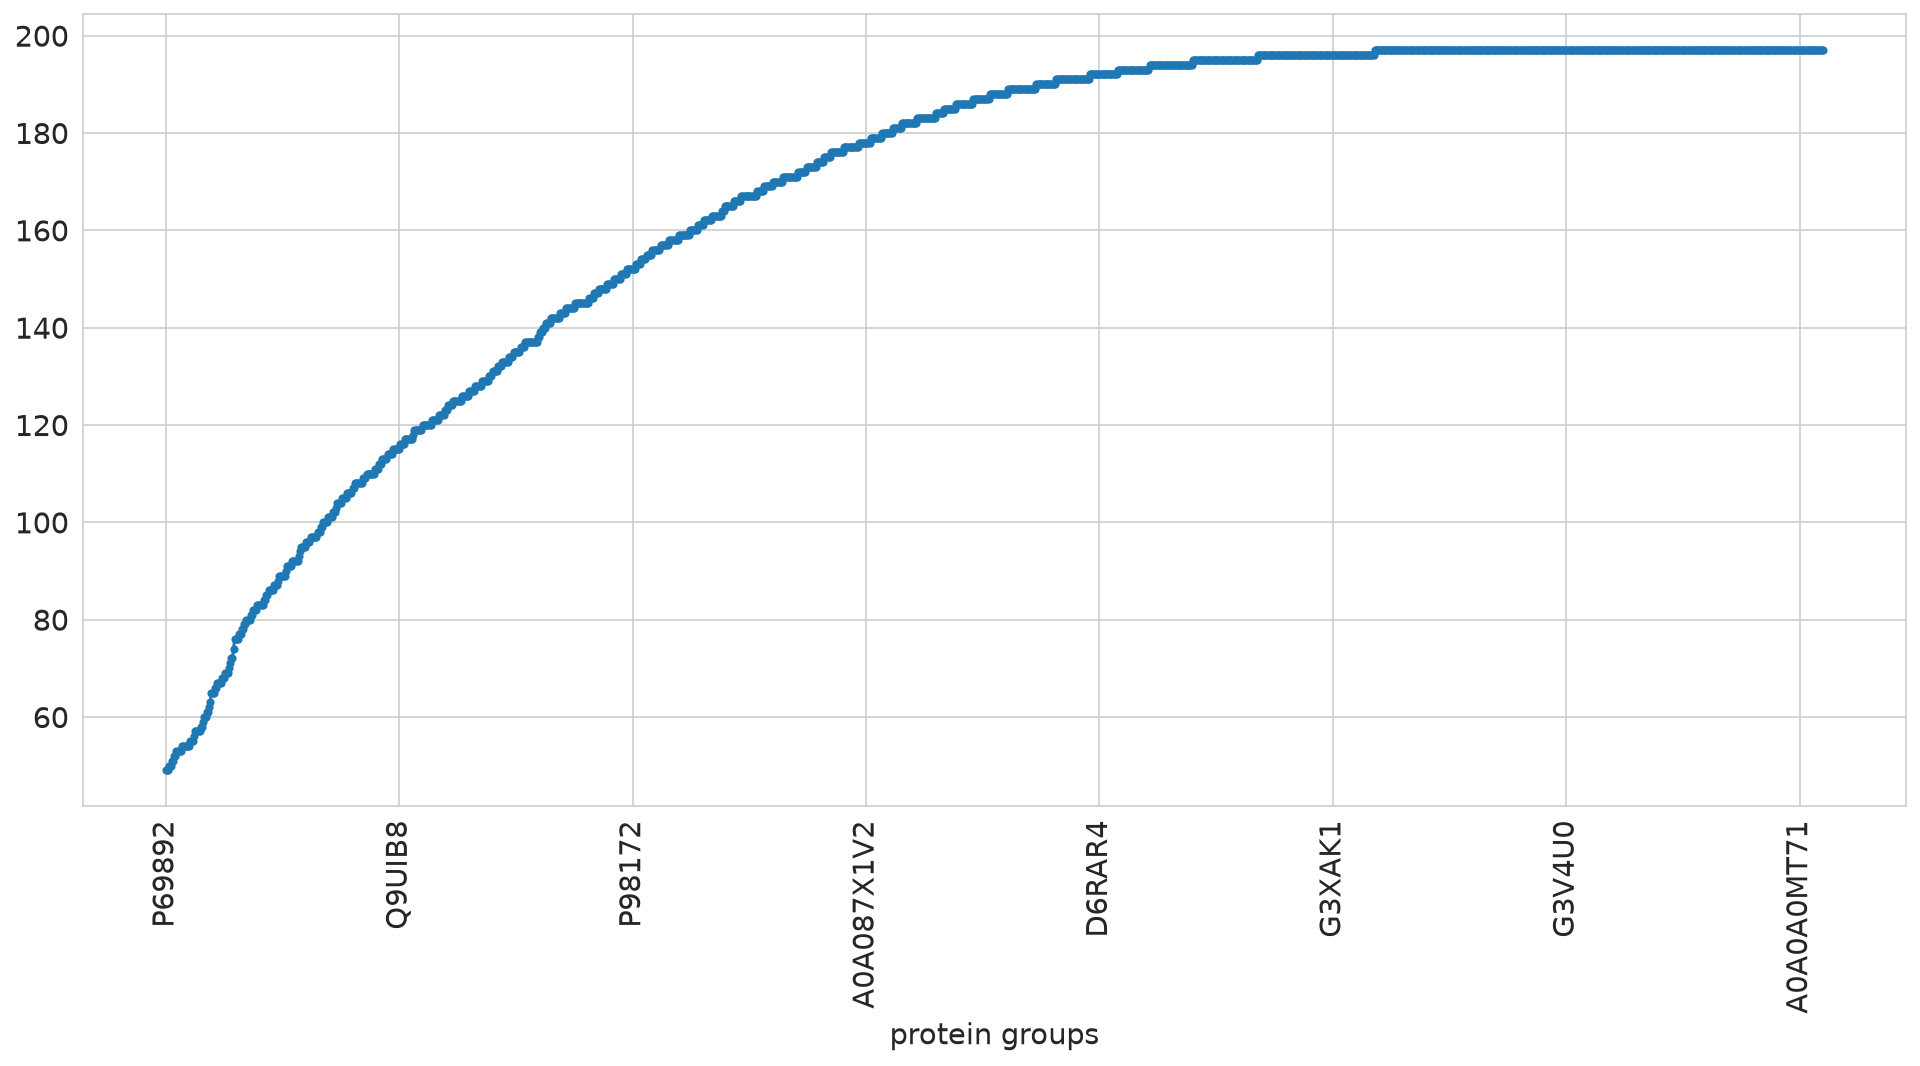
Save feature frequency of observed data based on complete clinical data
root - INFO runs/alzheimer_study/freq_features_observed.csv
ALD study approach using all measurements#
Use parameters as specified in ALD study.
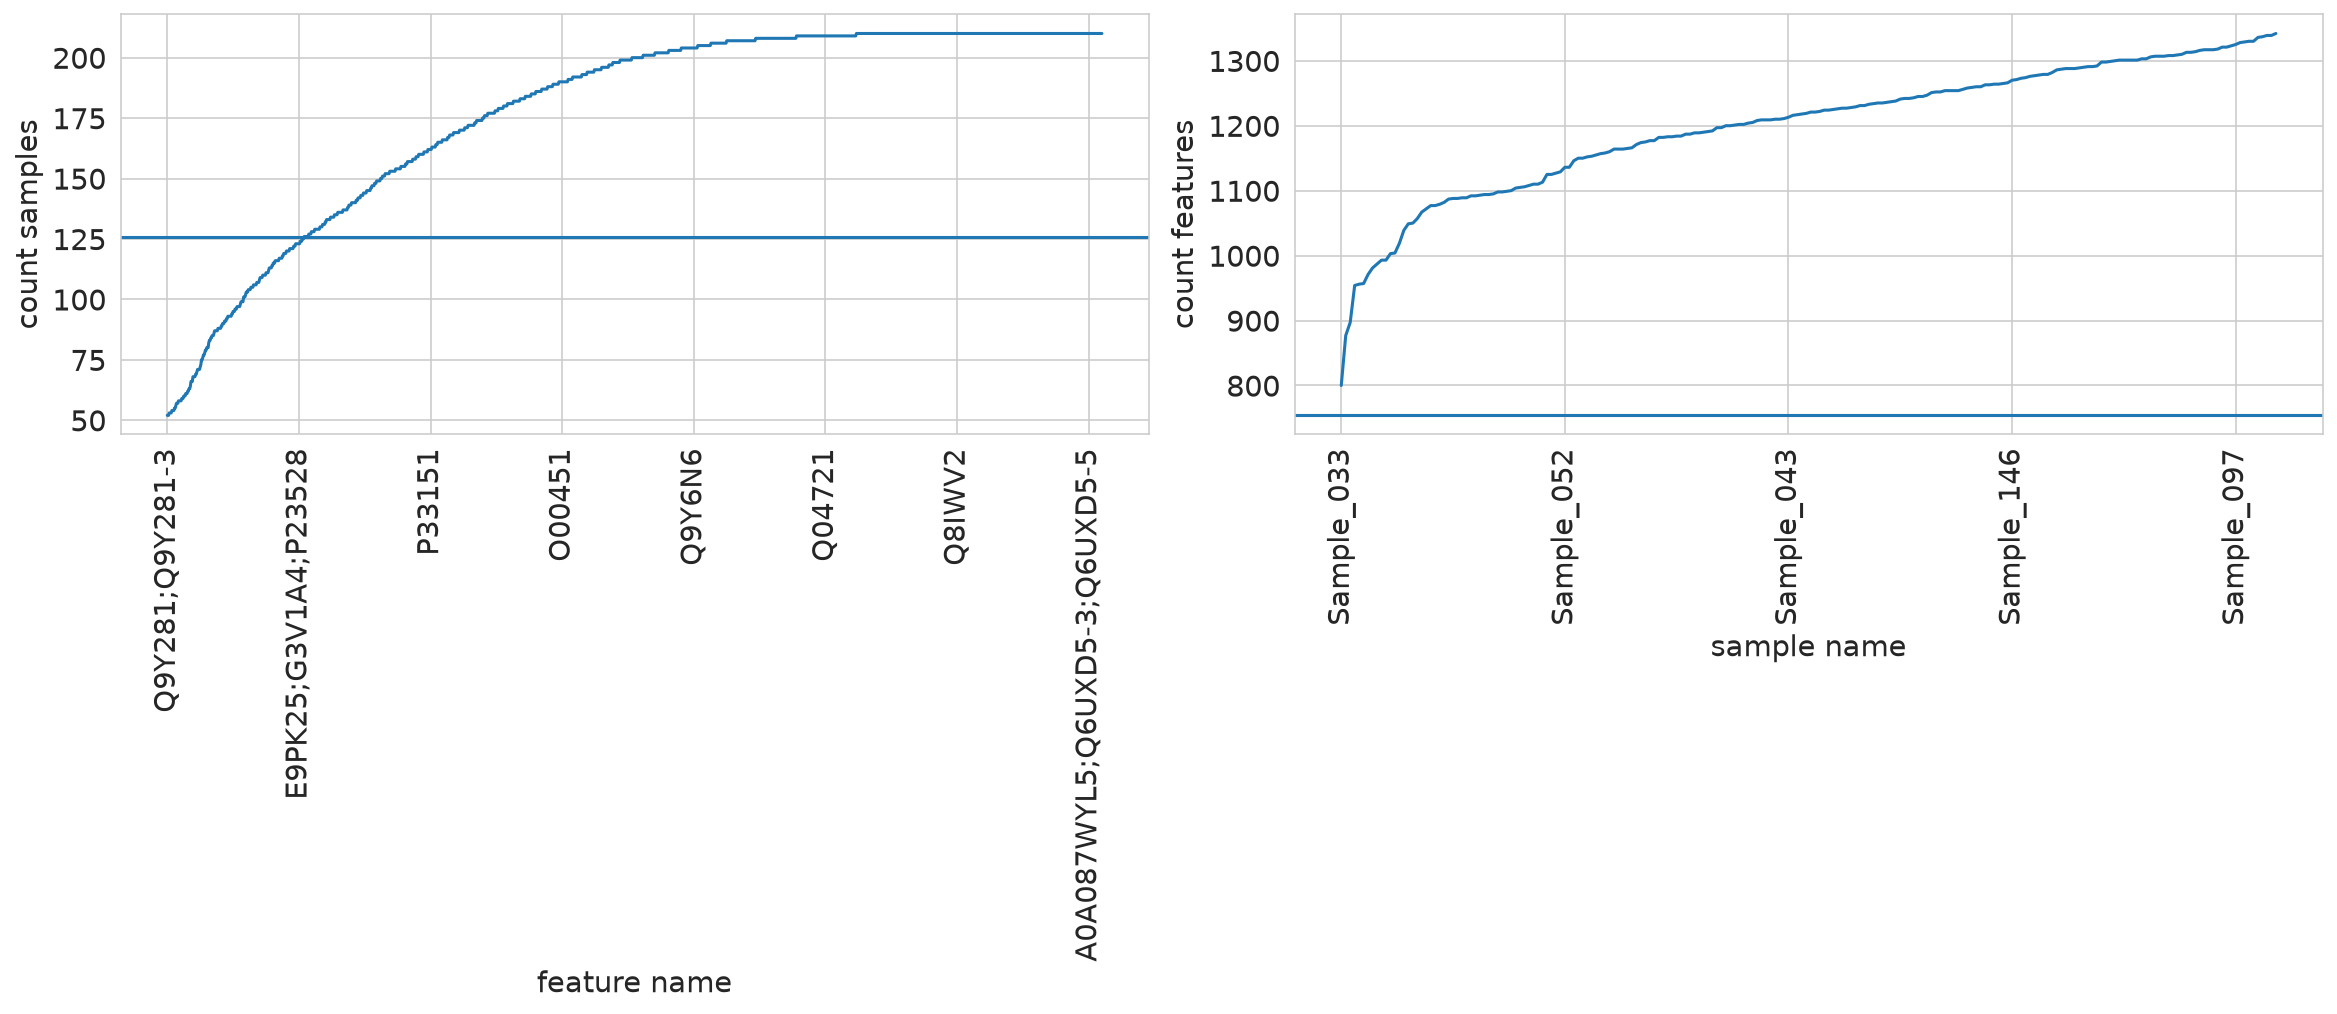
root - INFO     Initally: N samples: 210, M feat: 1421
root - INFO     Dropped features quantified in less than 126 samples.
root - INFO     After feat selection: N samples: 210, M feat: 1213
root - INFO     Min No. of Protein-Groups in single sample: 754
root - INFO     Finally: N samples: 210, M feat: 1213
| protein groups | A0A024QZX5;A0A087X1N8;P35237 | A0A024R0T9;K7ER74;P02655 | A0A024R3W6;A0A024R412;O60462;O60462-2;O60462-3;O60462-4;O60462-5;Q7LBX6;X5D2Q8 | A0A024R644;A0A0A0MRU5;A0A1B0GWI2;O75503 | A0A075B6H9 | A0A075B6I0 | A0A075B6I1 | A0A075B6I6 | A0A075B6I9 | A0A075B6J9 | ... | Q9Y653;Q9Y653-2;Q9Y653-3 | Q9Y696 | Q9Y6C2 | Q9Y6N6 | Q9Y6N7;Q9Y6N7-2;Q9Y6N7-4 | Q9Y6R7 | Q9Y6X5 | Q9Y6Y8;Q9Y6Y8-2 | Q9Y6Y9 | S4R3U6 |
|---|---|---|---|---|---|---|---|---|---|---|---|---|---|---|---|---|---|---|---|---|---|
| Sample ID | |||||||||||||||||||||
| Sample_000 | 15.912 | 16.852 | 15.570 | 16.481 | 20.246 | 16.764 | 17.584 | 16.988 | 20.054 | NaN | ... | 16.012 | 15.178 | NaN | 15.050 | 16.842 | 19.863 | NaN | 19.563 | 12.837 | 12.805 |
| Sample_001 | 15.936 | 16.874 | 15.519 | 16.387 | 19.941 | 18.786 | 17.144 | NaN | 19.067 | 16.188 | ... | 15.528 | 15.576 | NaN | 14.833 | 16.597 | 20.299 | 15.556 | 19.386 | 13.970 | 12.442 |
| Sample_002 | 16.111 | 14.523 | 15.935 | 16.416 | 19.251 | 16.832 | 15.671 | 17.012 | 18.569 | NaN | ... | 15.229 | 14.728 | 13.757 | 15.118 | 17.440 | 19.598 | 15.735 | 20.447 | 12.636 | 12.505 |
| Sample_003 | 16.107 | 17.032 | 15.802 | 16.979 | 19.628 | 17.852 | 18.877 | 14.182 | 18.985 | 13.438 | ... | 15.495 | 14.590 | 14.682 | 15.140 | 17.356 | 19.429 | NaN | 20.216 | 12.627 | 12.445 |
| Sample_004 | 15.603 | 15.331 | 15.375 | 16.679 | 20.450 | 18.682 | 17.081 | 14.140 | 19.686 | 14.495 | ... | 14.757 | 15.094 | 14.048 | 15.256 | 17.075 | 19.582 | 15.328 | 19.867 | 13.145 | 12.235 |
| ... | ... | ... | ... | ... | ... | ... | ... | ... | ... | ... | ... | ... | ... | ... | ... | ... | ... | ... | ... | ... | ... |
| Sample_205 | 15.682 | 16.886 | 14.910 | 16.482 | 17.705 | 17.039 | NaN | 16.413 | 19.102 | 16.064 | ... | 15.235 | 15.684 | 14.236 | 15.415 | 17.551 | 17.922 | 16.340 | 19.928 | 12.929 | 11.802 |
| Sample_206 | 15.798 | 17.554 | 15.600 | 15.938 | 18.154 | 18.152 | 16.503 | 16.860 | 18.538 | 15.288 | ... | 15.422 | 16.106 | NaN | 15.345 | 17.084 | 18.708 | 14.249 | 19.433 | NaN | NaN |
| Sample_207 | 15.739 | 16.877 | 15.469 | 16.898 | 18.636 | 17.950 | 16.321 | 16.401 | 18.849 | 17.580 | ... | 15.808 | 16.098 | 14.403 | 15.715 | 16.586 | 18.725 | 16.138 | 19.599 | 13.637 | 11.174 |
| Sample_208 | 15.477 | 16.779 | 14.995 | 16.132 | 14.908 | 17.530 | NaN | 16.119 | 18.368 | 15.202 | ... | 15.157 | 16.712 | NaN | 14.640 | 16.533 | 19.411 | 15.807 | 19.545 | 13.216 | NaN |
| Sample_209 | 15.727 | 17.261 | 15.175 | 16.235 | 17.893 | 17.744 | 16.371 | 15.780 | 18.806 | 16.532 | ... | 15.237 | 15.652 | 15.211 | 14.205 | 16.749 | 19.275 | 15.732 | 19.577 | 11.042 | 11.791 |
210 rows × 1213 columns
pimmslearn.plotting - INFO Saved Figures to runs/alzheimer_study/figures/tresholds_normal_imputation
Load model predictions for (real) missing data#
Load from:
PosixPath('runs/alzheimer_study/preds/pred_real_na_CF.csv')
Baseline comparison:
in case of RSN -> use filtering as done in original ALD study (Niu et al. 2022)
otherwise -> use all data
Use columns which are provided by model
Sample ID   protein groups
Sample_000  A0A075B6J9                 15.728
            A0A075B6Q5                 16.250
            A0A075B6R2                 16.916
            A0A075B6S5                 16.570
            A0A087WSY4                 16.459
                                        ...
Sample_209  Q9P1W8;Q9P1W8-2;Q9P1W8-4   16.416
            Q9UI40;Q9UI40-2            16.204
            Q9UIW2                     17.023
            Q9UMX0;Q9UMX0-2;Q9UMX0-4   12.883
            Q9UP79                     15.828
Name: intensity, Length: 46401, dtype: float64
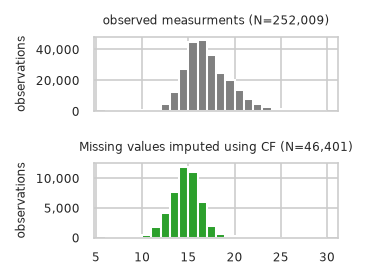
Plot unchanged observed intensities to imputed intensity distribution (if available):
pimmslearn.plotting - INFO Saved Figures to runs/alzheimer_study/diff_analysis/AD/dist_plots/real_na_obs_vs_CF.pdf
Dump frequency of histograms to file for reporting (if imputed values are used)
/home/runner/work/pimms/pimms/project/.snakemake/conda/43fbe714d68d8fe6f9b0c93f5652adb3_/lib/python3.12/site-packages/pimmslearn/pandas/__init__.py:320: FutureWarning: The default of observed=False is deprecated and will be changed to True in a future version of pandas. Pass observed=False to retain current behavior or observed=True to adopt the future default and silence this warning.
  _series = pd.cut(df[col], bins=bins).to_frame().groupby(col).size()
root - INFO     Counts per bin saved to runs/alzheimer_study/diff_analysis/AD/dist_plots/real_na_obs_vs_CF.xlsx
| observed | CF | |
|---|---|---|
| bin | ||
| (6, 7] | 1 | 0 |
| (7, 8] | 4 | 0 |
| (8, 9] | 39 | 0 |
| (9, 10] | 136 | 28 |
| (10, 11] | 529 | 511 |
| (11, 12] | 1,731 | 1,849 |
| (12, 13] | 4,644 | 4,172 |
| (13, 14] | 12,161 | 7,622 |
| (14, 15] | 27,515 | 11,946 |
| (15, 16] | 44,723 | 11,134 |
| (16, 17] | 45,981 | 5,957 |
| (17, 18] | 36,274 | 1,927 |
| (18, 19] | 25,049 | 563 |
| (19, 20] | 20,386 | 312 |
| (20, 21] | 13,495 | 250 |
| (21, 22] | 8,234 | 96 |
| (22, 23] | 4,885 | 22 |
| (23, 24] | 2,459 | 7 |
| (24, 25] | 1,237 | 2 |
| (25, 26] | 1,392 | 2 |
| (26, 27] | 643 | 0 |
| (27, 28] | 88 | 1 |
| (28, 29] | 216 | 0 |
| (29, 30] | 163 | 0 |
Mean shift by model#
Compare how imputed values are shifted in comparsion to overall distribution.
First by using all intensities without any grouping:
| mean | std | mean shift (in std) | std shrinkage | |
|---|---|---|---|---|
| observed | 17.119 | 2.567 | NaN | NaN |
| CF | 14.748 | 1.663 | 0.924 | 0.648 |
Then by averaging over the calculation by sample:
| observed | CF | |
|---|---|---|
| count | 1,200.043 | 220.957 |
| mean | 17.133 | 14.719 |
| std | 2.564 | 1.612 |
| mean_shift | 0.000 | 0.941 |
| std shrinkage | 1.000 | 0.629 |
Differential analysis#
Combine observed and imputed data (if available) for differential analysis:
| protein groups | A0A024QZX5;A0A087X1N8;P35237 | A0A024R0T9;K7ER74;P02655 | A0A024R3W6;A0A024R412;O60462;O60462-2;O60462-3;O60462-4;O60462-5;Q7LBX6;X5D2Q8 | A0A024R644;A0A0A0MRU5;A0A1B0GWI2;O75503 | A0A075B6H7 | A0A075B6H9 | A0A075B6I0 | A0A075B6I1 | A0A075B6I6 | A0A075B6I9 | ... | Q9Y653;Q9Y653-2;Q9Y653-3 | Q9Y696 | Q9Y6C2 | Q9Y6N6 | Q9Y6N7;Q9Y6N7-2;Q9Y6N7-4 | Q9Y6R7 | Q9Y6X5 | Q9Y6Y8;Q9Y6Y8-2 | Q9Y6Y9 | S4R3U6 |
|---|---|---|---|---|---|---|---|---|---|---|---|---|---|---|---|---|---|---|---|---|---|
| Sample ID | |||||||||||||||||||||
| Sample_000 | 15.912 | 16.852 | 15.570 | 16.481 | 17.301 | 20.246 | 16.764 | 17.584 | 16.988 | 20.054 | ... | 16.012 | 15.178 | 13.928 | 15.050 | 16.842 | 19.863 | 15.957 | 19.563 | 12.837 | 12.805 |
| Sample_001 | 15.936 | 16.874 | 15.519 | 16.387 | 13.796 | 19.941 | 18.786 | 17.144 | 16.473 | 19.067 | ... | 15.528 | 15.576 | 14.237 | 14.833 | 16.597 | 20.299 | 15.556 | 19.386 | 13.970 | 12.442 |
| Sample_002 | 16.111 | 14.523 | 15.935 | 16.416 | 18.175 | 19.251 | 16.832 | 15.671 | 17.012 | 18.569 | ... | 15.229 | 14.728 | 13.757 | 15.118 | 17.440 | 19.598 | 15.735 | 20.447 | 12.636 | 12.505 |
| Sample_003 | 16.107 | 17.032 | 15.802 | 16.979 | 15.963 | 19.628 | 17.852 | 18.877 | 14.182 | 18.985 | ... | 15.495 | 14.590 | 14.682 | 15.140 | 17.356 | 19.429 | 16.033 | 20.216 | 12.627 | 12.445 |
| Sample_004 | 15.603 | 15.331 | 15.375 | 16.679 | 15.473 | 20.450 | 18.682 | 17.081 | 14.140 | 19.686 | ... | 14.757 | 15.094 | 14.048 | 15.256 | 17.075 | 19.582 | 15.328 | 19.867 | 13.145 | 12.235 |
| ... | ... | ... | ... | ... | ... | ... | ... | ... | ... | ... | ... | ... | ... | ... | ... | ... | ... | ... | ... | ... | ... |
| Sample_205 | 15.682 | 16.886 | 14.910 | 16.482 | 14.837 | 17.705 | 17.039 | 16.179 | 16.413 | 19.102 | ... | 15.235 | 15.684 | 14.236 | 15.415 | 17.551 | 17.922 | 16.340 | 19.928 | 12.929 | 11.802 |
| Sample_206 | 15.798 | 17.554 | 15.600 | 15.938 | 15.641 | 18.154 | 18.152 | 16.503 | 16.860 | 18.538 | ... | 15.422 | 16.106 | 14.507 | 15.345 | 17.084 | 18.708 | 14.249 | 19.433 | 12.162 | 10.722 |
| Sample_207 | 15.739 | 16.877 | 15.469 | 16.898 | 14.446 | 18.636 | 17.950 | 16.321 | 16.401 | 18.849 | ... | 15.808 | 16.098 | 14.403 | 15.715 | 16.586 | 18.725 | 16.138 | 19.599 | 13.637 | 11.174 |
| Sample_208 | 15.477 | 16.779 | 14.995 | 16.132 | 14.431 | 14.908 | 17.530 | 16.340 | 16.119 | 18.368 | ... | 15.157 | 16.712 | 14.231 | 14.640 | 16.533 | 19.411 | 15.807 | 19.545 | 13.216 | 10.859 |
| Sample_209 | 15.727 | 17.261 | 15.175 | 16.235 | 15.107 | 17.893 | 17.744 | 16.371 | 15.780 | 18.806 | ... | 15.237 | 15.652 | 15.211 | 14.205 | 16.749 | 19.275 | 15.732 | 19.577 | 11.042 | 11.791 |
197 rows × 1421 columns
Results for target and clinical variables:
| SS | DF | F | p-unc | np2 | -Log10 pvalue | qvalue | rejected | ||
|---|---|---|---|---|---|---|---|---|---|
| protein groups | Source | ||||||||
| A0A024QZX5;A0A087X1N8;P35237 | AD | 1.070 | 1 | 7.461 | 0.007 | 0.038 | 2.161 | 0.020 | True |
| age | 0.005 | 1 | 0.038 | 0.846 | 0.000 | 0.073 | 0.898 | False | |
| Kiel | 0.324 | 1 | 2.260 | 0.134 | 0.012 | 0.872 | 0.231 | False | |
| Magdeburg | 0.606 | 1 | 4.223 | 0.041 | 0.022 | 1.385 | 0.088 | False | |
| Sweden | 2.063 | 1 | 14.383 | 0.000 | 0.070 | 3.699 | 0.001 | True | |
| ... | ... | ... | ... | ... | ... | ... | ... | ... | ... |
| S4R3U6 | AD | 1.832 | 1 | 3.644 | 0.058 | 0.019 | 1.238 | 0.117 | False |
| age | 0.856 | 1 | 1.703 | 0.193 | 0.009 | 0.713 | 0.307 | False | |
| Kiel | 2.730 | 1 | 5.430 | 0.021 | 0.028 | 1.681 | 0.050 | False | |
| Magdeburg | 3.283 | 1 | 6.528 | 0.011 | 0.033 | 1.943 | 0.030 | True | |
| Sweden | 18.244 | 1 | 36.280 | 0.000 | 0.160 | 8.065 | 0.000 | True |
7105 rows × 8 columns
Only for target:
| model | CF | ||||||||
|---|---|---|---|---|---|---|---|---|---|
| var | SS | DF | F | p-unc | np2 | -Log10 pvalue | qvalue | rejected | |
| protein groups | Source | ||||||||
| A0A024QZX5;A0A087X1N8;P35237 | AD | 1.070 | 1 | 7.461 | 0.007 | 0.038 | 2.161 | 0.020 | True |
| A0A024R0T9;K7ER74;P02655 | AD | 2.794 | 1 | 4.527 | 0.035 | 0.023 | 1.460 | 0.077 | False |
| A0A024R3W6;A0A024R412;O60462;O60462-2;O60462-3;O60462-4;O60462-5;Q7LBX6;X5D2Q8 | AD | 0.096 | 1 | 0.774 | 0.380 | 0.004 | 0.420 | 0.510 | False |
| A0A024R644;A0A0A0MRU5;A0A1B0GWI2;O75503 | AD | 0.184 | 1 | 1.326 | 0.251 | 0.007 | 0.600 | 0.376 | False |
| A0A075B6H7 | AD | 6.277 | 1 | 8.448 | 0.004 | 0.042 | 2.389 | 0.013 | True |
| ... | ... | ... | ... | ... | ... | ... | ... | ... | ... |
| Q9Y6R7 | AD | 0.675 | 1 | 1.850 | 0.175 | 0.010 | 0.756 | 0.284 | False |
| Q9Y6X5 | AD | 0.589 | 1 | 1.740 | 0.189 | 0.009 | 0.724 | 0.301 | False |
| Q9Y6Y8;Q9Y6Y8-2 | AD | 0.973 | 1 | 3.028 | 0.083 | 0.016 | 1.079 | 0.158 | False |
| Q9Y6Y9 | AD | 0.159 | 1 | 0.235 | 0.628 | 0.001 | 0.202 | 0.733 | False |
| S4R3U6 | AD | 1.832 | 1 | 3.644 | 0.058 | 0.019 | 1.238 | 0.117 | False |
1421 rows × 8 columns
Save all results to file:
PosixPath('runs/alzheimer_study/diff_analysis/AD/scores/diff_analysis_scores_CF.pkl')
Saved files:
{'mask_sample_with_complete_clinical_data.csv': 'runs/alzheimer_study/diff_analysis/AD/mask_sample_with_complete_clinical_data.csv',
 'feat_freq_observed': 'runs/alzheimer_study/freq_features_observed.csv',
 'real_na_obs_vs_CF.pdf': 'runs/alzheimer_study/diff_analysis/AD/dist_plots/real_na_obs_vs_CF.pdf',
 'diff_analysis_scores_CF.pkl': 'runs/alzheimer_study/diff_analysis/AD/scores/diff_analysis_scores_CF.pkl'}